This is the draft website for Programming Historian lessons under review. Do not link to these pages.
For the published site, go to https://programminghistorian.org
Contents
- Introduction
- Creating a Plain Text Corpus
- Uploading the Corpus
- Exploring the corpus
- Document summary: basic characteristics of your set of texts
- Cirrus and summary: frequencies and stop word filters
- Terms
- Words in context
- Exporting tables
- Activity Answers
- Bibliography
- Footnotes
Introduction
In this tutorial, you will learn how to organize a set of texts for research; that is, you will learn the basic steps of creating a corpus. You will also learn the main metrics of quantitative text analysis. For this purpose, you will learn to use a platform that does not require installation (just an Internet connection): Voyant Tools (Sinclair and Rockwell, 2016). This tutorial is intended as a first step in an increasingly complex series of corpus linguistics methods. In this sense, this text can be considered as one of the options for corpus analysis you can find in PH (see for example: “Corpus Analysis with Antconc”).
Corpus Analysis
Corpus analysis is a type of content analysis that allows large-scale comparisons of a set of texts or a corpus.
Since the advent of computing, both computational linguists and information retrieval specialists have created and used software to appreciate patterns that are not evident in traditional reading or to corroborate hypotheses they intuited when reading certain texts but required laborious, costly, and mechanical work. For example, to obtain usage and decline patterns of certain terms in a given time, it was necessary to hire people to manually review a text and note how many times the sought term appeared. Early on, observing the counting capabilities of computers, these specialists promptly wrote programs to facilitate the task of creating frequency lists or concordance tables (i.e., tables with the left and right contexts of a term). The program you will learn to use in this tutorial falls into this context.
What You Will Learn in This Tutorial
Voyant Tools is a web-based tool that does not require the installation of any specialized software as it works on any computer with an Internet connection.
As stated in this other tutorial, this tool is a good entry point to more complex methods.
By the end of this tutorial, you will be able to:
- Assemble a plain text corpus
- Load your corpus into Voyant Tools
- Understand and apply different corpus segmentation techniques
- Identify basic characteristics of your text set:
- Length of the uploaded documents
- Lexical density (called vocabulary density on the platform)
- Average words per sentence
- Read and understand different statistics about words: absolute frequency, normalized frequency, statistical skewness, and distinctive words
- Search for keywords in context and export data and visualizations in different formats (csv, png, html)
Creating a Plain Text Corpus
Although VoyantTools can work with many formats (HTML, XML, PDF, RTF, and MS Word), in this tutorial we will use plain text (.txt). Plain text has three fundamental advantages: it has no additional formatting, does not require a special program, and does not require extra knowledge. The steps to create a plain text corpus are:
1. Search for Texts
The first thing you need to do is search for the information that interests you. For this tutorial, we have prepared a corpus of President George Washington’s Annual Messages to Congress from 1789 to 1796. This corpus has been released under a Creative Commons CC BY 4.0 license and you can use it as long as you cite the source as follows:
Cisneros, J., & Martinez, A. (2024). presidential-speeches-GW_v1 (Versión v1).
2. Copy to a Plain Text Editor
Once you have located the information, the second step is to copy the text you are interested in from the first word spoken to the last and save it in a plain text editor. For example:
3. Save File
When saving the text, you must consider three essential things.
The first is to save your texts in UTF-8, which is a standard encoding format for Spanish and other languages.
What is UTF-8?
Although we see an “É” when typing an “É” on our screen; for a computer, “É” is a series of zeros and ones that are interpreted as an image depending on the “translator” or “encoder” being used. The encoder that contains binary codes for all the characters used in Spanish is UTF-8. Continuing with the example, “11000011” is an eight-bit string – that is, eight information spaces – which in UTF-8 are interpreted as “É”.
On Windows:
1. Open Notepad
Figure 1. Save in UTF-8 on Windows
2. After pasting or writing the text, click on ‘Save As’ 3. In the ‘Encoding’ window, select ‘UTF-8’ 4. Choose a file name and save it as .txt (Torresblanca, 2014)
On Mac:
1. Open TextEdit
Figure 2. Save in UTF-8 on Mac
2. Paste the text you want to save 3. Convert to plain text (option in the ‘Format’ menu) 4. When saving, select the encoding ‘UTF-8’ (Creative Corner, 2016)
On Linux:
1. Open Gedit
Figure 3. Save in UTF-8 on Ubuntu
2. After pasting the text, when saving, select ‘UTF-8’ in the ‘Character Encoding’ window
The second is that your file name should not contain accents nor spaces to ensure it can be opened on other operating systems
Why avoid accents and spaces in file names?
For similar reasons to the previous point, a file named Ébano.txt will not always be correctly understood by all operating systems since several have a different default encoder. Many use ASCII, for example, which only has seven bits, so the last bit (1) of “11000011” is interpreted as the start of the next character and the interpretation is skewed.
The third is to integrate context metadata (e.g., date, genre, author, origin) into the file name, allowing you to divide your corpus according to different criteria and also read the results better.
For this tutorial, we have named the files with the month, day, year, and order in which President George Washington delivered the Annual Message to Congress.
january_8_1790_first.txt has the month of the speech separated by an underscore, the number of month, the year, and the order.
Uploading the Corpus
On the Voyant Tools homepage, you will find four simple options for loading texts. The first two options are in the white box. In this box, you can directly paste a text that you have copied from somewhere; or, paste web addresses – separated by commas – of the sites where the texts you want to analyze are located. A third option is to click on “Open” and select one of the two corpora that Voyant has preloaded (the works of Shakespeare or the novels of Austen: both in English).
Finally, there is the option we will use in this tutorial, where you can directly upload the documents you have on your computer. In this case, we will upload the complete corpus of presidential speeches.
To upload the materials, click on the icon that says “Upload,” open your file explorer, and, while holding down the ‘Shift’ key, select all the files you want to analyze.
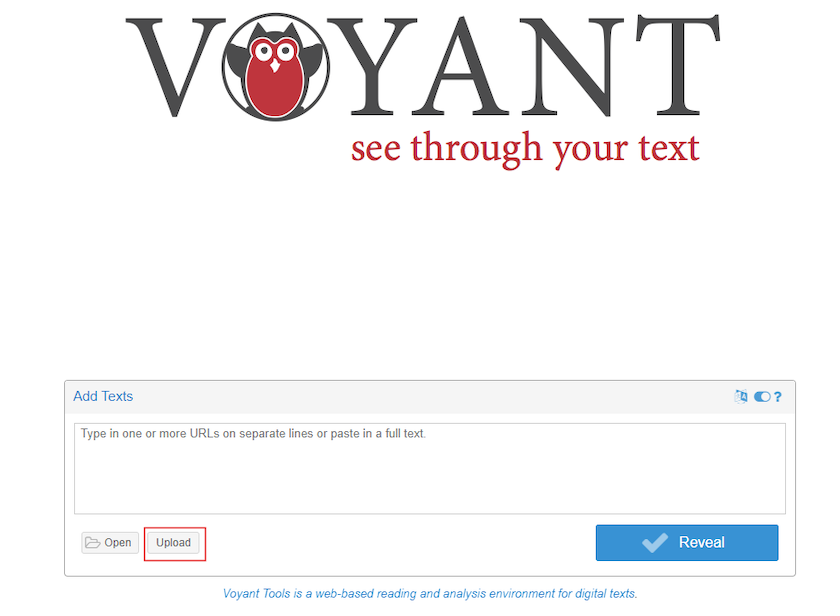
Figure 4. Upload documents
Exploring the corpus
Once all the files are uploaded, you will reach the ‘interface’ (‘skin’) that has five default tools. Here is a brief explanation of each of these tools:
- Cirrus: word cloud showing the most frequent terms
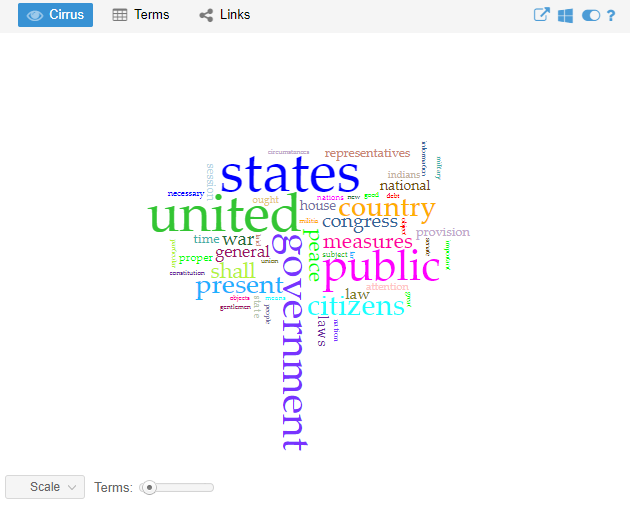
Figure 5. Cirrus
- Reader: space for reviewing and reading the complete texts with a bar graph indicating the amount of text each document has
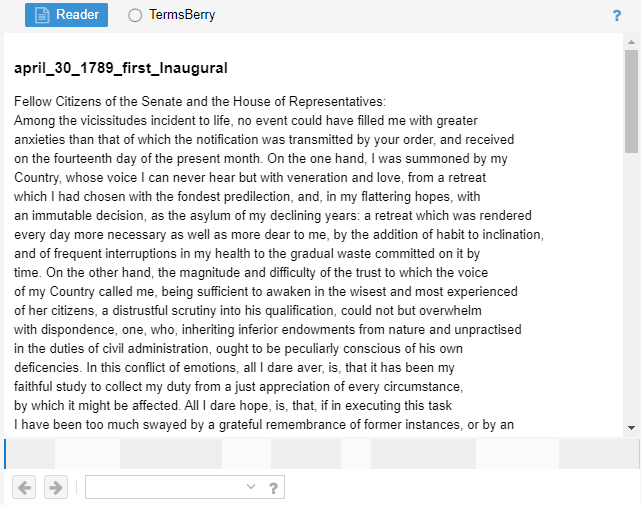
Figure 6. Reader
- Trends: distribution graph showing terms throughout the corpus (or within a document when only one is uploaded)
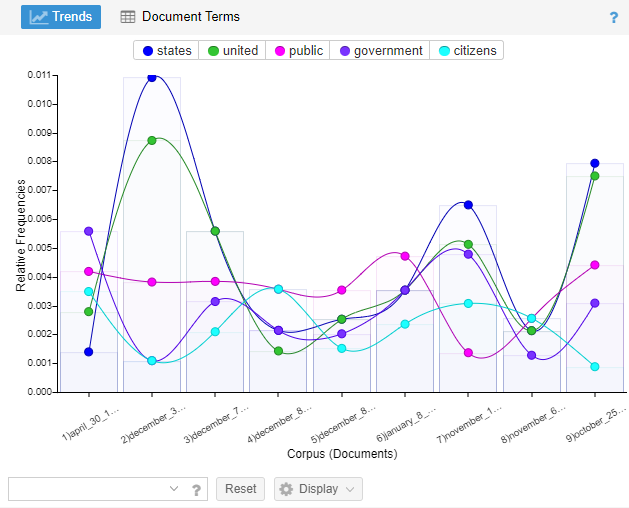
Figure 7. Trends
- Summary: provides an overview of certain textual statistics of the current corpus
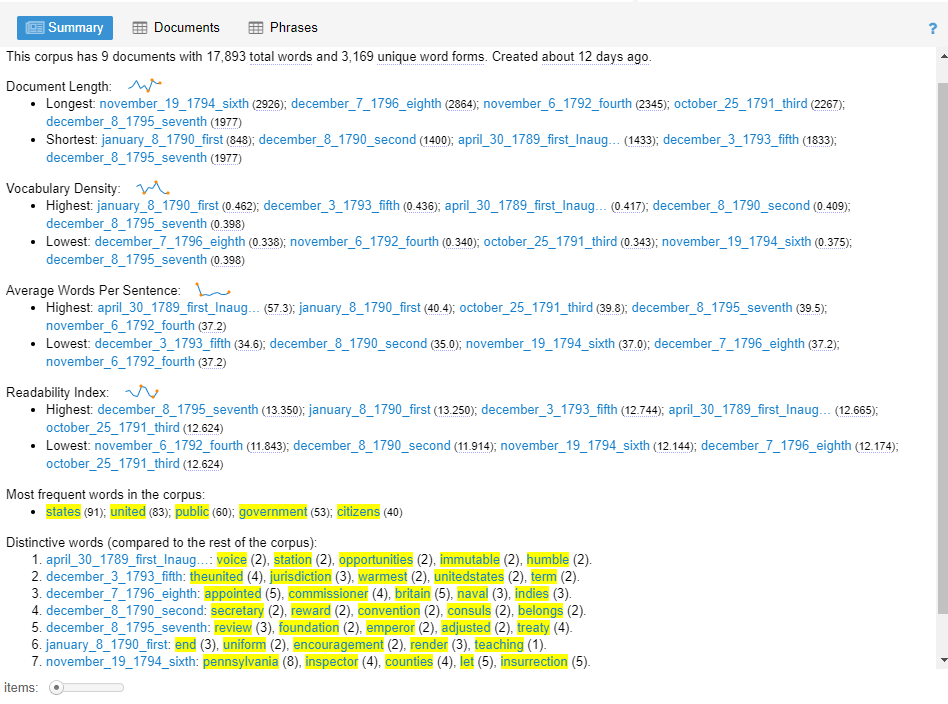
Figure 8. Summary
- Contexts: concordance showing each occurrence of a keyword with a bit of surrounding context
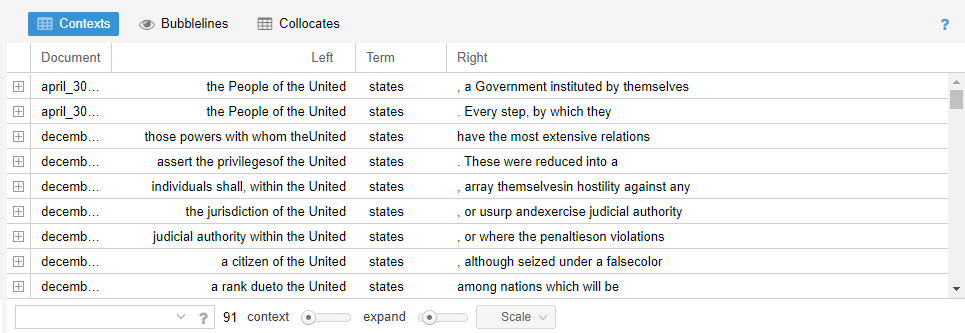
Figure 9. Contexts
Document summary: basic characteristics of your set of texts
One of the most informative windows in Voyant is the summary. Here we get a overview of some statistics about our corpus, so it serves as a good starting point. In the following sections, you will get an explanation of the different measures that appear in this window.
Number of texts, words, and unique words
The first sentence we read looks something like this:
This corpus has 9 documents with 17,893 total words and 3,169 unique word forms. Created 53 second ago.
From the start, with this information, we know exactly how many distinct documents were uploaded (9); how many words there are in total (17,893); and how many unique words exist (3,169).
In the following lines, you will find nine activities that can be resolved in groups or individually. Five of them have answers at the end of the text to serve as a guide. The last four are open to reflection/discussion by those who carry them out.
Activity 1
If our corpus consisted of two documents; one that said: “I’m hungry”; and another that said: “I’m sleepy.” What information would appear in the first line of the summary? Complete:
This corpus has __ documents with a total of __ words and __ unique words.
Document length
The second thing we see is the “document length” section. Here is what it shows:
-
Longest: november_19_1794_sixth (2926); december_7_1796_eighth (2864); november_6_1792_fourth (2345); october_25_1791_third (2267); december_8_1795_seventh (1977)
-
Shortest: january_8_1790_first (848); december_8_1790_second (1400); april_30_1789_first_Inaug… (1433); december_3_1793_fifth (1833); december_8_1795_seventh (1977)
Activity 2
1. What can we conclude about the longest and shortest texts considering the metadata in the file name (year, country, president)? 2. Why is it useful to know the length of the texts?
Vocabulary density
Vocabulary density is measured by dividing the number of unique words by the total number of words. The closer the density index is to one, the richer the vocabulary, meaning it is denser.
Activity 3
1. Calculate the density of the following stanzas, compare, and comment:
Stanza 1. From “Silly Men Who Accuse” by Sor Juana Inés de la Cruz:
For plain default of common sense, could any action be so queer as oneself to cloud the mirror, then complain that it’s not clear?
Stanza 2. From “Alejandro” by Nadir Khayat and Stefani Germanotta:
Don’t call my name, don’t call my name Alejandro. I’m not your babe, I’m not your babe Fernando. Don’t wanna kiss, don’t wanna touch.
2. Read the lexical density data of the documents in our corpus, what do they tell you?
-
Highest: january_8_1790_first (0.462); december_3_1793_fifth (0.436); april_30_1789_first_Inaug… (0.417); december_8_1790_second (0.409); december_8_1795_seventh (0.398)
-
Lowest: december_7_1796_eighth (0.338); november_6_1792_fourth (0.340); october_25_1791_third (0.343); november_19_1794_sixth (0.375); december_8_1795_seventh (0.398)
3. Compare them with the information about their length, what do you notice?
Words per sentence
The way Voyant calculates sentence length should be considered very approximate, especially because it is complicated to distinguish between the end of an abbreviation and that of a sentence or other uses of punctuation (for example, in some cases a semicolon marks the boundary between sentences). The sentence analysis is performed by a template with instructions or ‘class’ of the Java programming language called BreakIterator.
Activity 4
1. Look at the statistics of words per sentence (wps) and answer: what pattern or patterns can you observe if you consider the “wps” index and the metadata of country, president, and year contained in the document name?
2. Click on the names of some documents that interest you by their “wps” index. Direct your gaze to the “Reader” window and read a few lines. Does reading the original text add new information to your data reading? Comment on why.
Cirrus and summary: frequencies and stop word filters
Since we have an idea of some global characteristics of our documents, it’s time to start looking at the characteristics of the terms in our corpus, and one of the most common entry points is understanding what it means to analyze a text based on its frequencies.
Unfiltered frequencies
The first aspect we will work on is gross frequency, and for this, we will use the Cirrus window.
Activity 5
1. What are the most frequent words in the corpus?
2. What do these words tell us about the corpus? Are they all significant?
Tip: hover your mouse over the words to get their exact frequencies.
Stop words
Importance is not an intrinsic value and will always depend on our interests. For this very reason, Voyant offers the option to filter certain words. A common procedure to obtain relevant words is to filter out grammatical lexical units or stop words: articles, prepositions, interjections, pronouns, etc. (Peña and Peña, 2015).
Activity 6
1. What stop words are in the word cloud?
2. Which ones would you eliminate and why?
Voyant already has a stop word list loaded for English; however, we can edit it as follows:
1. Place our cursor at the top right of the Cirrus window and click on the icon that looks like a switch.
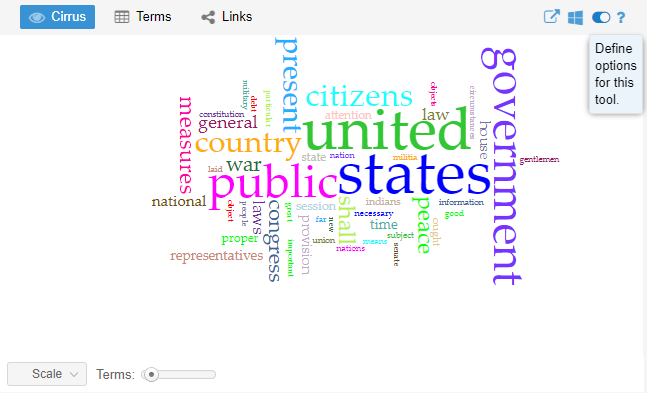
Figure 10. Open options
2. A window with different options will appear, we select the first one “Edit List.”
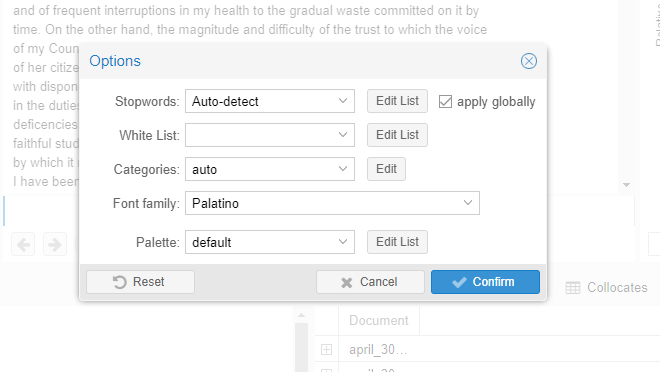
Figure 11. Edit list
3. We add the “stop” words, always separated by a newline (Enter key).
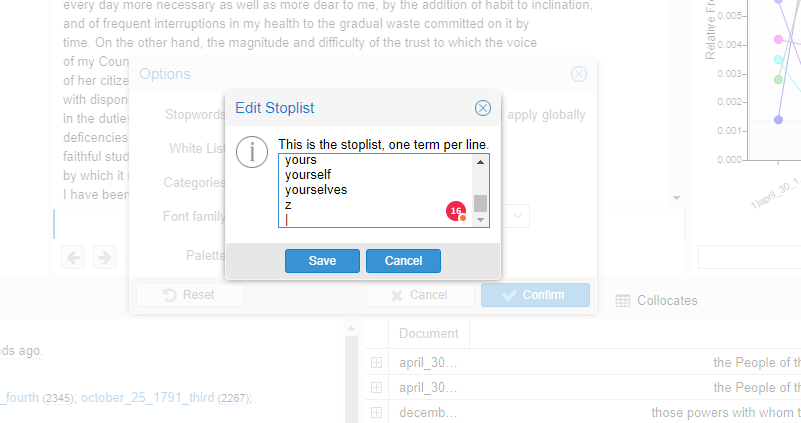
Figure 12. Remove stopwords
4. Once we have added the words we want to filter, we click on “Save.”
Frequencies with filtered stop words
Let’s go back to this section of the summary. As we said in the previous point, filtered words affect other fields in Voyant. In this case, if you left the “Apply to all” box selected, the list that appears below the legend: “Most frequent word in the corpus,” will show the most repeated words excluding those that were filtered. In my case, it shows:
states (91); united (83); public (60); government (53); citizens (40)
Activity 7
Reflect on these words and think about what information they provide and how this information differs from what you get by looking at the word cloud.
Terms
Although frequencies can tell us something about our texts, there are many variables that can make these numbers less meaningful. In the following sections, different statistics that can be obtained in the “Terms” tab to the left of the “Cirrus” button in Voyant’s default layout will be explained.
Normalized frequency
In the previous section, we observed the “gross frequency” of words. However, if we had a corpus of six words and another of 3,000 words, gross frequencies are not very informative. Three words in a corpus of six words represent 50% of the total, while three words in a corpus of 6,000 represent 0.1% of the total. To avoid the over-representation of a term, linguists have devised another measure called: “normalized relative frequency.” This is calculated as follows: Gross Frequency * 1,000,000 / Total Number of Words. Let’s analyze a verse as an example. Let’s take the phrase: “But my heart says no, says no,” which has seven words in total. If we calculate its gross and relative frequency, we have:
| word | gross frequency | normalized frequency |
|---|---|---|
| heart | 1 | 1 * 1,000,000 / 7 = 142,857 |
| says | 2 | 2 * 1,000,000 / 7 = 285,714 |
What is the advantage of this? If we had a corpus in which the word corazón had the same proportion, for example, 1,000 occurrences out of 7,000 words, while the gross frequency is very different, the normalized frequency would be the same, as 1,000 * 1,000,000 / 7,000 is also 142,857.
Let’s see how this works in Voyant Tools:
1. In the Cirrus section (the word cloud), click on ‘Terms’. This will open a table that by default has three columns: Terms (with the list of words in the documents, excluding the filtered ones), Count (with the ‘gross or net frequency’ of each term), and Trend (with a graph of the distribution of a word considering its relative frequency). To get information about the relative frequency of a term, in the column names bar, on the far right, click on the triangle that offers more options and in ‘Columns’ select the ‘Relative’ option as shown in the image below:
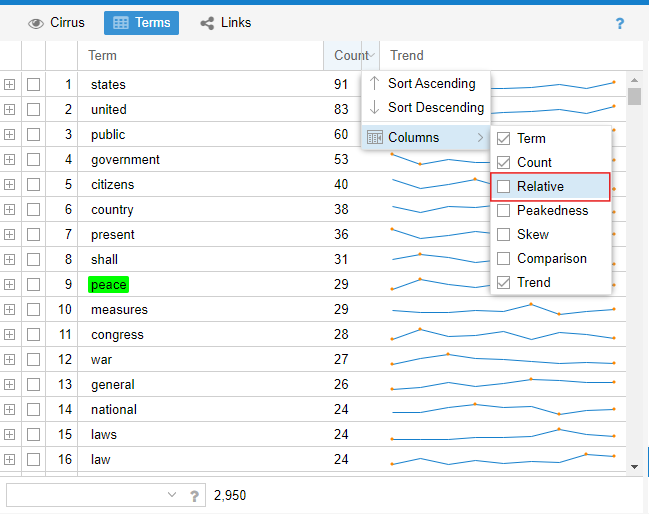
Figure 13. Relative frequency
2. If you sort the columns in descending order as you would in a spreadsheet program, you will see that the order of gross frequency (‘Count’) and relative frequency (‘Relative’) is the same. What is this measure useful for? For when we compare different corpora. A corpus is a set of texts with something in common. In this case, Voyant is interpreting all the speeches as a single corpus. If we wanted each speech to be a different corpus, we would have to save our text in a table, in HTML or XML, where the metadata is expressed in columns (in the case of the table) or in tags (in the case of HTML or XML).
Statistical skewness
Although relative frequency helps us understand the distribution of our corpus, there is a measure that gives us information about how constant a term is throughout our documents: statistical skewness.
This measure gives us an idea of the probability distribution of a variable without having to make its graphical representation. It is calculated by observing the deviations of a frequency from the mean, to determine whether those occurring to the right of the mean (negative skewness) are greater than those to the left (positive skewness). The closer to zero the degree of statistical skewness, the more regular the distribution of that term (i.e., it occurs with a very similar mean in all documents). What is not very intuitive is that if a term has statistical skewness with positive numbers, it means that term is below the mean, and the larger the number, the more skewed the term is (i.e., it occurs a lot in one document but hardly at all in the corpus). Negative numbers, on the other hand, indicate that the term tends to be above the mean.
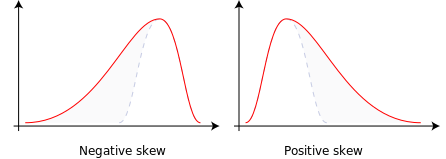
Figure 14. Statistical asymmetry
To obtain this measure in Voyant, we need to repeat the steps we did to get the relative frequency, but this time select “Skew.” This measure allows us to observe then, that the word “war,” for example, despite having a high frequency, not only does not have a constant frequency throughout the corpus, but it tends to be below the mean because its statistical skewness is positive (0.8).
Differentiated words
As you might suspect, the most interesting information is generally not found within the most frequent words, as these tend to be the most obvious. In the field of information retrieval, other measures have been devised that allow locating the terms that make one document stand out from another. One of the most commonly used measures is called tf-idf (term frequency – inverse document frequency). This measure seeks to express numerically how relevant a document is in a given collection; that is, in a collection of texts about “apples,” the word apple can occur many times, but it tells us nothing new about the collection, so we do not want to know the gross frequency of the words (term frequency) but weigh it against how unique or common it is in the given collection (inverse document frequency).
In Voyant, tf-idf is calculated as follows:
Gross Frequency (tf) / Number of Words (N) * log10 (Number of Documents / Number of times the term appears in the documents).
\[tfidf_{t,d} = \left( \frac{tf_{t,d}}{N_i} \right) \cdot \log_{10} \frac{|D|}{\{ d \in D : t \in d \}}\]Activity 8
Look at the differentiated words (compared to the rest of the corpus) of each document and note what hypotheses you can derive from them.
- april_30_1789_first_Inaug…: voice (2), station (2), opportunities (2), immutable (2), humble (2).
- december_3_1793_fifth: theunited (4), jurisdiction (3), warmest (2), unitedstates (2), term (2).
- december_7_1796_eighth: appointed (5), commissioner (4), britain (5), naval (3), indies (3).
- december_8_1790_second: secretary (2), reward (2), convention (2), consuls (2), belongs (2).
- december_8_1795_seventh: review (3), foundation (2), emperor (2), adjusted (2), treaty (4).
- january_8_1790_first: end (3), uniform (2), encouragement (2), render (3), teaching (1).
- november_19_1794_sixth: pennsylvania (8), inspector (4), counties (4), let (5), insurrection (5).
- november_6_1792_fourth: newspapers (6), cent (5), transmission (3), postage (3), case (4).
- october_25_1791_third: immediate (4), subscriptions (3), lands (4), possible (3), vacant (2).
Words in context
The project with which some histories inaugurate the Digital Humanities is the Index Thomisticus, a concordance of the work of Thomas Aquinas led by the philologist and religious Roberto Busa (Hockey, 2004), in which dozens of women participated in the coding (Terras, 2013). This project, which took years to complete, is a built-in function in Voyant Tools: in the lower right corner, in the “Contexts” window, it is possible to make left and right concordance queries of specific terms.
The table we see has the following default columns:
- Document: here appears the name of the document in which the keyword(s) of the query occur(s)
- Left: left context of the keyword (this can be modified to cover more or fewer words and if you click on the cell, it expands to show more context)
- Keywords: keyword(s) of the query
- Right: right context
The Position column can be added, indicating the place in the document where the queried term is found:
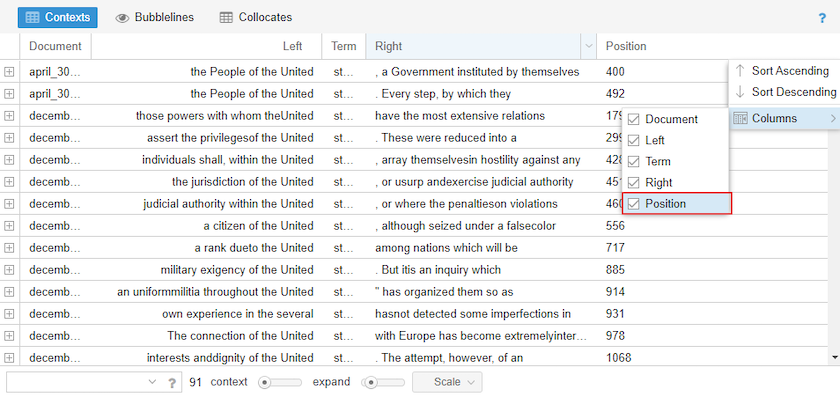
Figure 15. Add position column
Voyant allows the use of wildcards to search for variations of a word. Here are some combinations:
- pe*: this query will return all words that start with the prefix “pe” (peace, people, person)
- *th: terms that end with the suffix “th” (health, truth, month)
- peace, war: you can search for more than one term by separating them with commas
- “love for my Country”: search for the exact phrase
- “country precarious”~ 5: search for the terms within the quotes, the order does not matter, and there can be up to 5 words in between.
Activity 9
Search for the use of a term that seems interesting to you, using some of the advanced query strategies. Sort the rows using the different columns (Document, Left, Right, and Position): what conclusions can you derive about your terms using the information from these columns?
Exporting tables
To export the data, click on the box with an arrow that appears when you hover over the right corner of “Contexts”. Then select the “Export current data” option and click on the last option Export all available data as tab separated values (text)grid.
This leads to a page where the fields are separated by a tab:
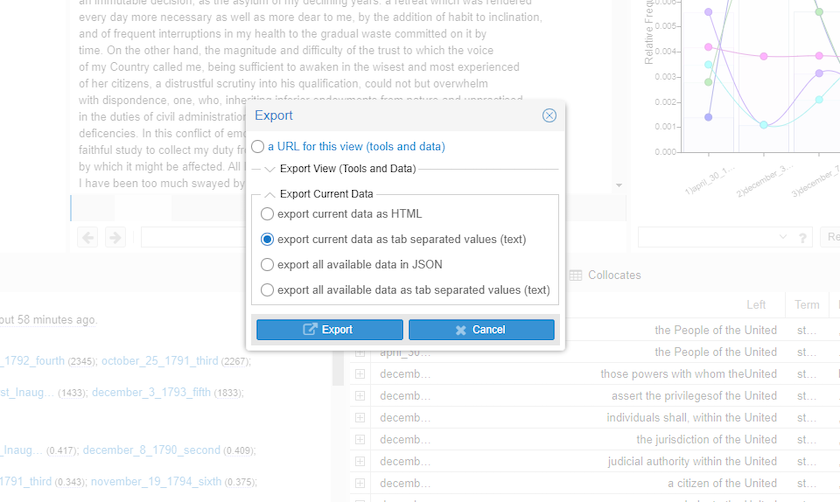
Figure 16. Export contexts
Select all data (Ctrl+A or Ctrl+E); copy it (Ctrl+C) and paste it into a spreadsheet (Ctrl+V). If this does not work, save the data as a .txt file in a simple text editor (don’t forget the UTF-8 encoding!) and then import the data into your spreadsheet. In Excel, this is done in the “Data” tab and then “From Text File.”
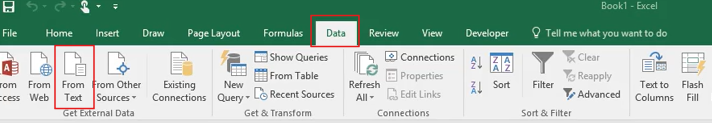
Figure 17. Import data from a text file
Activity Answers
Activity 1
This corpus has 2 documents with a total of 4 words and 3 unique words (I’m, hungry, sleepy).
Activity 2
- We might observe, for example, that the longest texts are the sixth, eighth Annual Message to Congress. Regarding the shortest, we could see that while the shortest are first and second Annual Message to Congress.
- Knowing the length of our texts allows us to understand the homogeneity or disparity of our corpus, as well as understand certain trends (for example, in which years speeches tended to be shorter, when the length changed, etc.).
Activity 3
-
The first stanza has 22 words and 21 are unique words, so 21/22 equals a vocabulary density of 0.955: https://voyant-tools.org/?corpus=b6b17408eb605cb1477756ce412de78e. The second stanza has 24 words and 13 are unique words, so 13/24 equals a vocabulary density of 0.542: https://voyant-tools.org/?corpus=366630ce91f54ed3577a0873d601d714.
As we can see, the difference between a verse by Sor Juana Inés de la Cruz and another composed by Nadir Khayat and Stefani Germanotta has a density difference of 0.328, which is not very high. We must be careful in interpreting these numbers as they are only a quantitative indicator of vocabulary richness and do not include parameters such as rhyme complexity or term complexity.
There seems to be a correspondence between shorter and denser speeches, which is natural since the shorter a text is, the less “opportunity” there is to repeat. However, this could also tell us something about the styles of different countries or presidents. The less dense, the more likely they are to use more rhetorical resources.
Activity 4
These results seem to indicate that President Kirchner, in addition to having the longest speeches, makes the longest sentences; however, we have to be careful with conclusions of this kind, as these are oral speeches where punctuation depends on who transcribes the text.
Activity 5
- states (91); united (83); public (60); government (53); citizens (40).
- The first and the second are words specific to the name of the country. If we wanted to omit them, the best approach would be to edit the stop words list and add them.
Bibliography
- Hockey, Susan. 2004. “The History of Humanities Computing”. A Companion to Digital Humanities. Schreibman et al. (editors). Blackwell Publishing Ltd. doi:10.1002/9780470999875.ch1.
- Peña, Gilberto Anguiano, and Catalina Naumis Peña. 2015. «Extracción de candidatos a términos de un corpus de la lengua general». Investigación Bibliotecológica: Archivonomía, Bibliotecología e Información 29 (67): 19-45. https://doi.org/10.1016/j.ibbai.2016.02.035.
- Sinclair, Stéfan and Geoffrey Rockwell, 2016. Voyant Tools. Web. http://voyant-tools.org/.
- Terras, Melissa, 2013. “For Ada Lovelace Day – Father Busa’s Female Punch Card Operatives”. Melissa Terras’ Blog. Web. http://melissaterras.blogspot.com/2013/10/for-ada-lovelace-day-father-busas.html.
This tutorial was written thanks to the support of the British Academy and prepared during the Programming Historian Writing Workshop at the Universidad de los Andes in Bogotá, Colombia, from July 31 to August 3, 2018.